BOOMERANG GENERATION
An opportunity for BOOMER-Age America
U.S. and State of New Mexico
Report done by Itsaso Fernandez and Maria Jose Anitua
This report analyzes two intergenerational research topics as an opportunity to connect them as systemic factors to do more with less as a path to greater sustainability. It proposes a circular economy housing model based on home sharing, taking care of people, the planet, and profit (Triple Bottom Line), connecting them as a great opportunity for housing intergenerational connections.
A) Boomerang Generation
This section analyzes the boomerang generation, defined as young adults who return to or remain in the parental home, across two geographic scales: the United States as a whole and the state of New Mexico. Examining both levels makes it possible to identify trends that occur nationwide and distinguish them from those specifically related to New Mexico’s socioeconomic context.
1. United States: national overview
1.1 Key 2024 data
According to the 2024 American Community Survey (ACS), as analyzed by NAHB / Eye on Housing (November 2025), 32.5% of adults aged 18 to 34 in the U.S. lived with their parents in 2024, up from 31.8% in 2023.
1.2 Variation by state (ACS 2024)
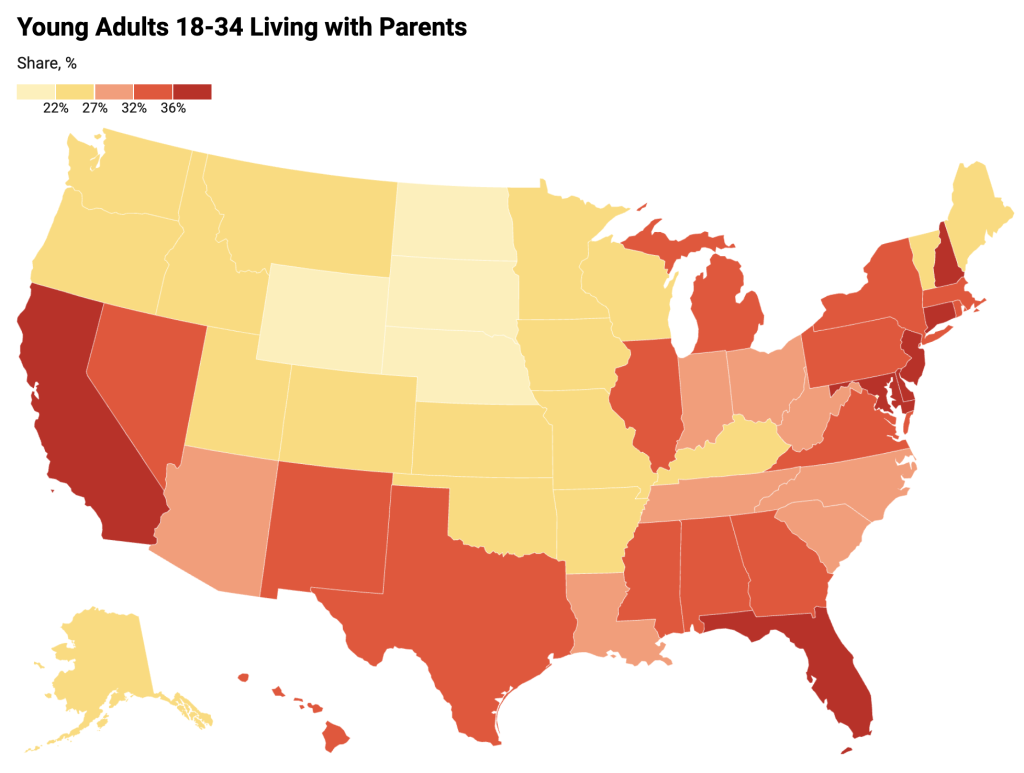
Figure 1: Percentage of adults ages 18–34 living with their parents, by U.S. state
Note. Adapted from NAHB / Eye on Housing (2025).
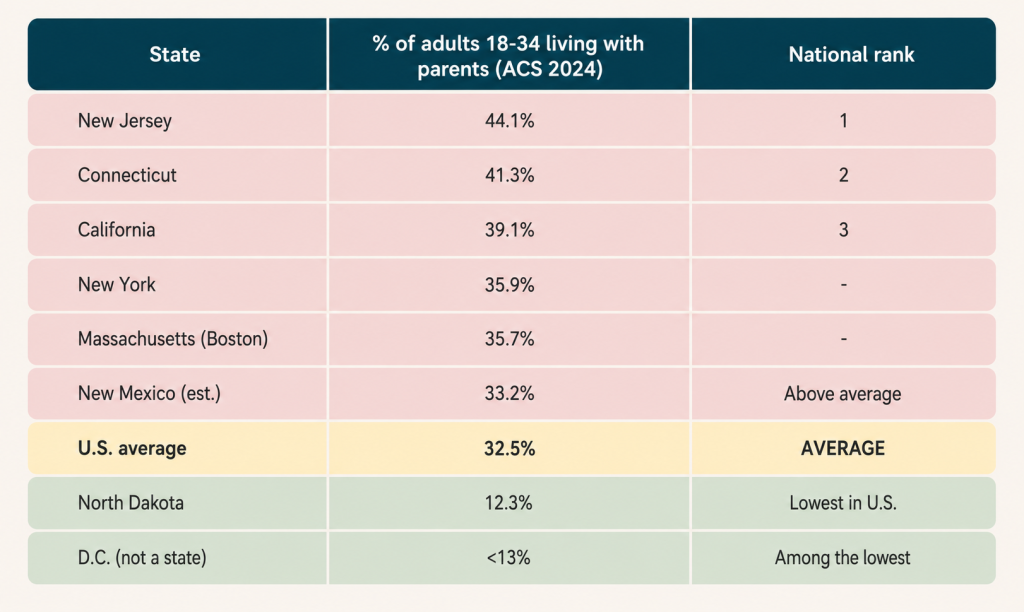
The gap between states is enormous. Housing costs are the main explanatory factor: states where a higher share of renters spend more than 30% of their income on housing are also the states with more young people living with their parents (NAHB, 2025).
In short, the cost of housing is one of the main factors explaining why more and more young people are delaying moving out. The data show that in regions where purchase prices, and especially rental prices, are higher, the number of young adults who continue living with their parents increases.
This relationship is clearest in places where a large share of renters must spend at least 30% of their income on housing, the threshold above which the burden is considered high. In these areas, access to independent housing is harder, forcing many young people to remain in the family home or even return to it after having lived independently.
As a result, the shortage of affordable housing has become one of the main factors driving the boomerang generation phenomenon, as it limits young people’s ability to start or sustain an independent life.
Table 1: Percentage of adults 18–34 living with their parents by U.S. state
Note. Own elaboration based on data from (NAHB, 2025)
2. State of New Mexico
2.1 Socioeconomic profile
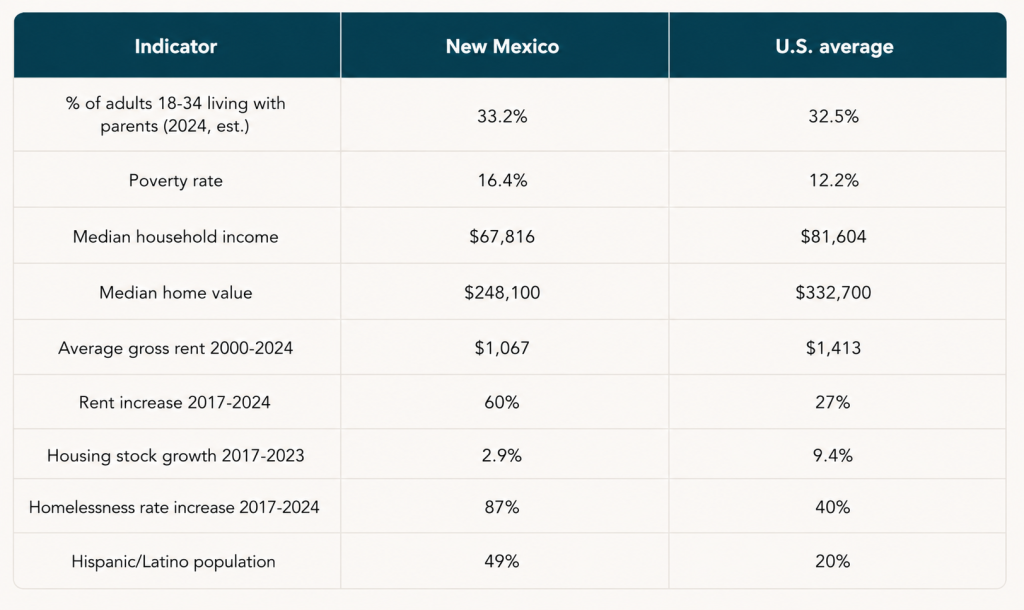
New Mexico (2.13 million residents, ACS 2024) is the 36th most populous state and the 3rd poorest state in the U.S., with a poverty rate of 16.4% versus 12.2% nationally (Census Reporter, ACS 2024). Median household income is $67,816 (17% below the national average of $81,604), and per capita income is $37,978.
The population is 49% Hispanic, making New Mexico the most Hispanic state in the continental U.S.
The price level is 92.2% of the national average (BEA), which partially offsets the income gap.
2.2 Accelerated housing crisis
New Mexico has experienced a more severe housing crisis than the national average: rents rose (+60%) between 2017 and 2024, more than double the U.S. average (+27%), and the homelessness rate grew (+87%) over the same period, also more than double the national average (+40%), according to analysis by Pew Charitable Trusts / Gensler (August 2025). The state added only 2.9% to its housing stock between 2017 and 2023, well below the national figure of 9.4%.
2.3 Boomerang generation en New Mexico
The evidence analyzed indicates that the boomerang generation constitutes a trend with a marked structural character that is expected to continue consolidating in the coming years. The combination of high levels of structural poverty, a large Hispanic population, where multigenerational living is more culturally accepted, and the rapid deterioration in housing affordability places the share of young adults aged 18–34 living with their parents at approximately 33.2%, above the U.S. national average of 32.5%.
This trend is further supported by the National Association of Home Builders (NAHB, 2025), which identifies housing affordability, particularly rising rental costs and home purchase prices, as the strongest predictor of young adults returning to the parental home. In this regard, New Mexico stands out as one of the states where the rental cost burden has increased the most, rising by approximately 60% over the past seven years, compared with a 27% increase nationwide. These figures suggest that the boomerang generation will remain a growing structural reality in New Mexico, particularly among lower-income households, where living with parents is increasingly becoming a long-term economic necessity rather than a temporary life-stage decision.
Table 2 : Summary table, New Mexico vs. U.S. average
Note. Own elaboration based on data from the U.S. Census Bureau (2024), Federal Reserve Bank of St. Louis (2025), Pew Charitable Trusts (2025), and the U.S. Census Bureau QuickFacts (2024). Data on median home value and median gross rent were retrieved from the U.S. Census Bureau QuickFacts.
B) Baby Boomers (born between 1946 and 1964) Research in Progress
This section analyzes the baby boomers:
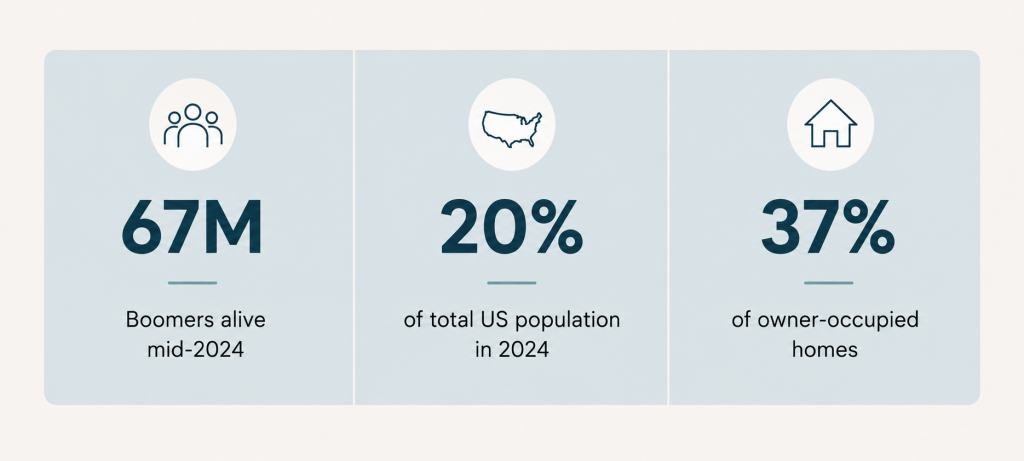
Table 3: Key Baby Boomer indicators
Sources: U.S. Census Bureau · Pew Research Center · Brookings Institution · Construction Coverage / ACS 2023 · 2024–2026
1. Who are the Bay Boomers?
Born between 1946 and 1964, Baby Boomers are ages 62–80 in 2026, and the oldest cohort turned 80 this year. From a peak of 79 million in 1999, the generation has declined to approximately 67 million as of July 1, 2024, representing about 20% of the U.S. population and making it the third-largest living generation, behind Millennials and Generation Z (Pew Research Center). This demographic shift reflects a broader generational transition, as “the combined millennial, Gen Z, and younger generations numbered 166 million as of July 2019, or 50.7% of the nation’s population—larger than 162 million Americans associated with the combined Gen X, baby boomer, and older cohorts” (Frey, 2020). Despite their declining numbers, Boomers retain outsized influence over housing markets, politics, and national wealth.
2. Population Trayectory
2.1. Historical Trajectory
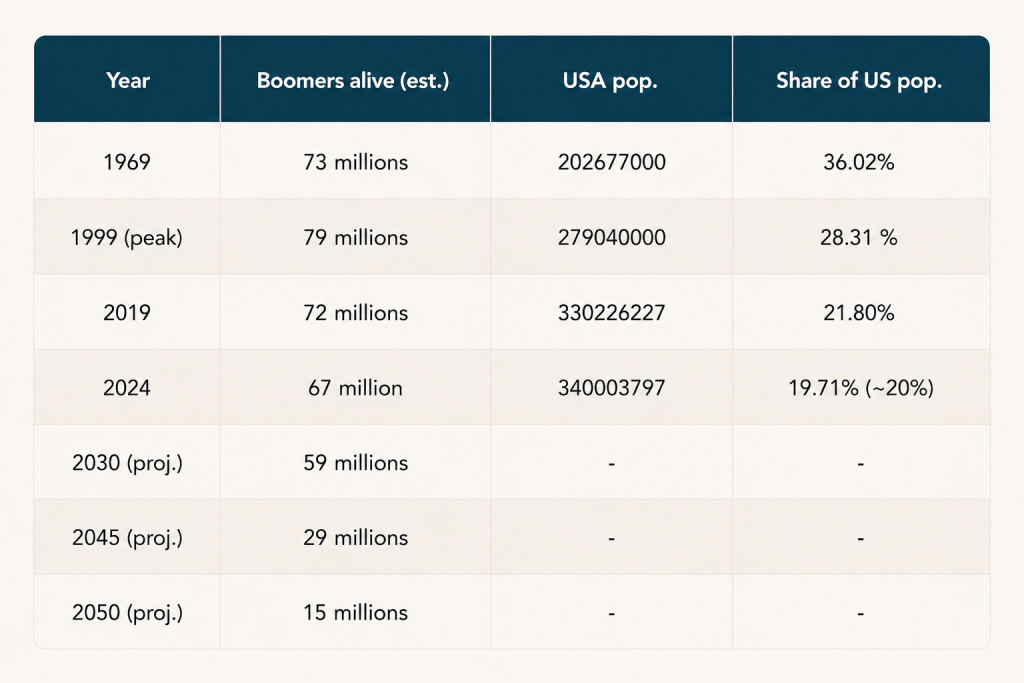
Table 4: Estimated Size of the U.S. Baby Boomer Population and Its Share of the Total Population
Note. Own elaboration based on data from the Pew Research Center and the World Bank (Population, total, indicator SP.POP.TOTL).
All estimates and calculations were performed by the author.
The table illustrates the changing population size and demographic importance of the Baby Boomer generation in the United States over time. In 1969, Boomers numbered approximately 73 million people and represented 36.02% of the U.S. population. Their population reached its peak in 1999 with about 79 million people, but their share of the total population declined to 28.31% as the overall U.S. population continued to grow. Since then, the number of living Boomers has gradually decreased, reaching an estimated 67 million in 2024, representing around 20% of the U.S. population. Future projections show a significant decline, with the Boomer population expected to fall to 59 million by 2030, 29 million by 2045, and only 15 million by 2050. This trend reflects the aging and gradual disappearance of one of the largest generations in U.S. history, creating major impacts on housing, retirement systems, healthcare needs, and the country’s demographic structure.
2.2 The 80+ Wave
The most relevant data point for the next twenty years is not how many baby boomers there are, but how many will be over 80. The first major wave (born 1946-1950) reached that age between 2026 and 2030. This anticipates unprecedented pressure on assisted living facilities, the Medicare system, and home care programs. Projections from the Brookings Institution indicate that the 80+ population will double in two decades (14.7 million in 2025 → 29.4 million in 2045), a growth that no state welfare system has fully planned for. The parallel with Europe, where Italy, Spain, and Greece are experiencing a similar crisis, is direct.
3. Where Boomers Are Concentrated
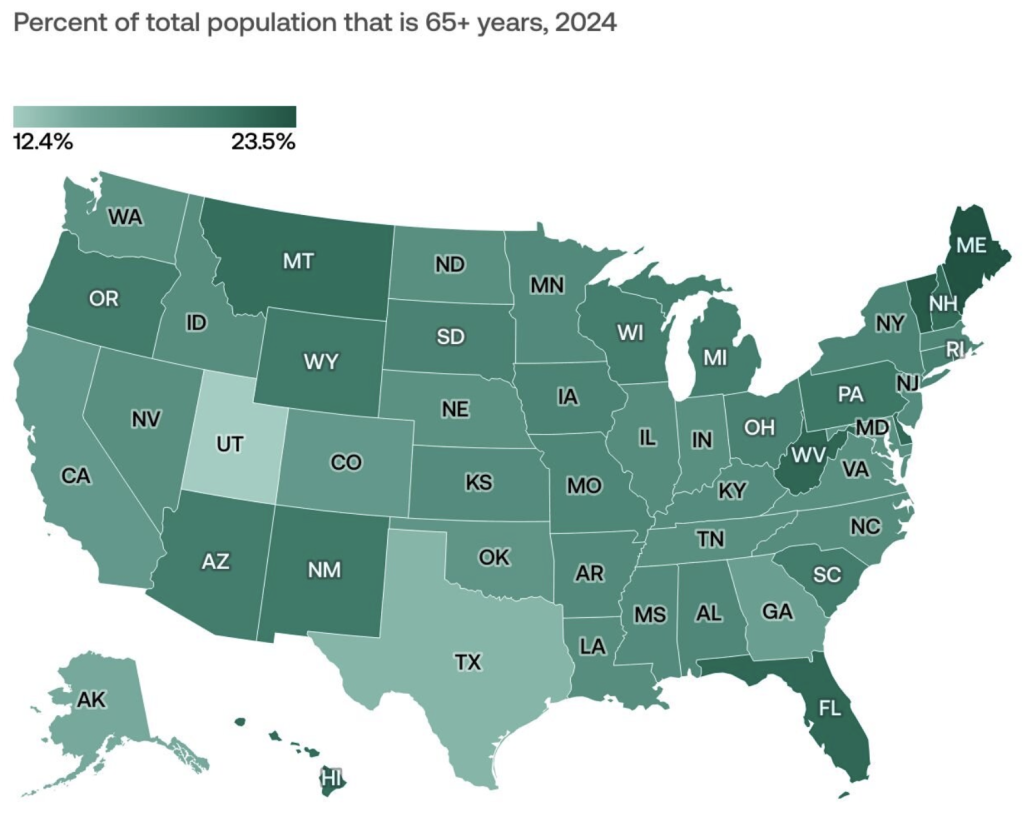
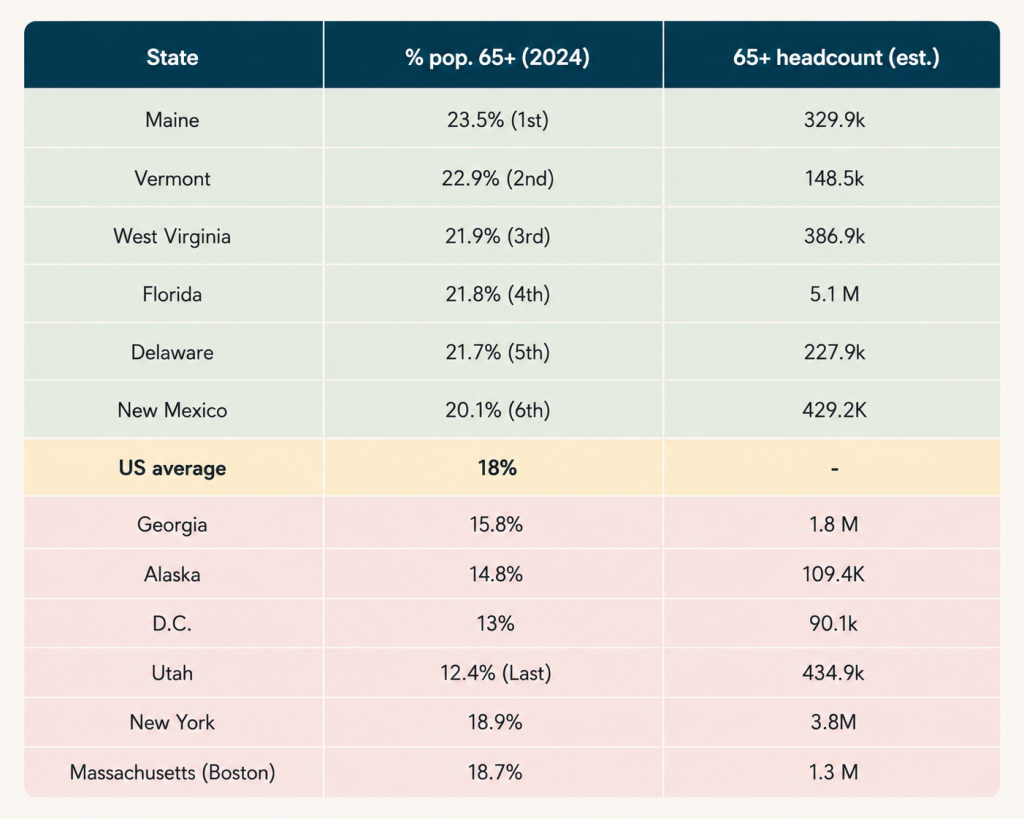
The 65+ share of each state’s populationis the best available state-level proxy for Boomer concentration. The national average is 18%, ranging from Maine (23.5%) to Utah (12.4%), (USAFacts, 2025).
Figure 2: Percentage of the Population Aged 65 and Older by State, 2024
Note. From “Percent of Total Population That Is 65+ Years, 2024,” by USAFacts, 2025, based on data from the U.S. Census Bureau American Community Survey (https://usafacts.org/articles/america-is-getting-older-which-states-have-the-largest-elderly-populations/). Copyright 2025 by USAFacts.
Table 5: Percentage of Population Aged 65 Years and Over by U.S. State (2024)
Note. Author’s own elaboration based on data from USAFacts’ Which states have the largest elderly populations? y How many people live in the U.S.? Population estimates and calculations were performed by the author using data originally sourced from the U.S. Census Bureau.
Although states such as Maine, Vermont, and West Virginia rank among those with the highest proportion of residents aged 65 and over, they do not contain the largest number of older adults in absolute terms. This apparent contradiction is explained by differences in total population size. States with relatively small populations can exhibit a high percentage of older residents even when their total elderly population is comparatively modest. Conversely, highly populated states such as California (6.5 M), Florida (5.1M),Texas (4.4M), and New York (3.8 M) contain the largest numbers of people aged 65 and over despite ranking lower by percentage, because their much larger overall populations dilute the relative share of older adults (USAFacts, 2025). Therefore, the proportion of older adults is a more appropriate indicator for assessing the demographic ageing of a state’s population, whereas absolute counts primarily reflect population size rather than the intensity of the ageing process.
4. Boomers’ Grip on Housing
Baby Boomers (approximately those born between 1946 and 1964) represent around 20% of the U.S. population, yet they own 28% of homes with three or more bedrooms, despite the fact that many of them are empty nesters (Redfin, 2026). In other words, they control a larger share of the housing stock than their demographic weight would suggest.
During 2023 and 2024, 30-year mortgage interest rates remained around or above 7% for much of the period. At the same time, many Baby Boomers still held mortgages that had been taken out years earlier at historically low interest rates. This created a strong lock-in effect, discouraging homeowners from selling their properties (Freddie Mac, 2023; FHFA, 2024). As a result, many prefer to remain in their current homes, even when those homes are larger than they actually need.
When millions of homeowners decide not to sell, the supply of available housing decreases. At the same time, demand remains high because younger generations continue to form new households and seek independent housing.
When supply declines while demand remains strong, housing prices increase. Consequently, the median home price in the United States reached $412,500 in 2024, the highest level on record (Harvard JCHS, 2025).
With higher home prices and elevated mortgage interest rates, many young adults, with low income, are unable to afford either buying or renting a home independently. As a result, many remain in or return to the parental home, giving rise to what is known as the Boomerang Generation. In 2024, approximately 32.5% of Americans aged 18–34 were living with their parents.
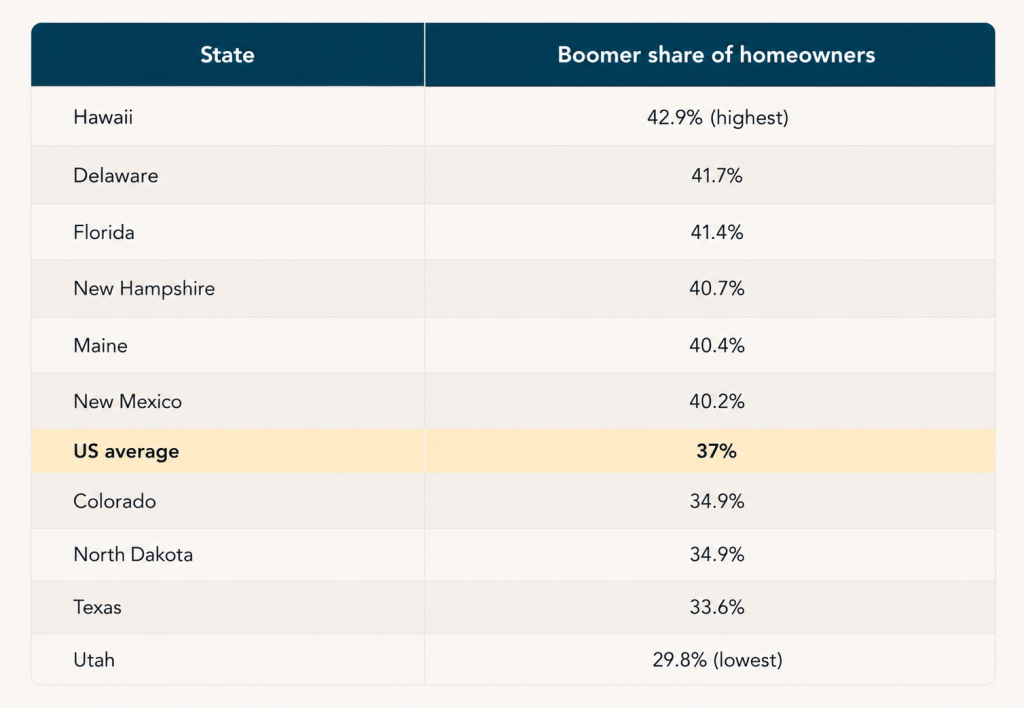
Table 6: Boomer share of homeowners by state
Note. Own elaboration based on Construction Coverage’s analysis of the 2023 American Community Survey (ACS), U.S. Census Bureau. Percentages represent the share of owner-occupied households headed by Baby Boomers (individuals aged 59–77 in 2023). The national estimate is 37.0%.
As shown in Table 6, 37.0% of all owner-occupied households in the United States are headed by Baby Boomers (individuals aged 59–77 in 2023). Nevertheless, this proportion varies considerably across states, ranging from 42.9% in Hawaii, the highest value, to 29.8% in Utah, the lowest. States such as Delaware (41.7%), Florida (41.4%), New Hampshire (40.7%), and Maine (40.4%) also report values well above the national average, whereas Texas (33.6%), Colorado (34.9%), and North Dakota (34.9%) remain below it. These findings highlight important regional differences in the concentration of Baby Boomer homeowners. However, although this measure does not account for housing size or the number of bedrooms, (most of baby bloomers homes use to be with al least 3 bedrooms) meaning that it reflects only the distribution of homeownership by generation and not whether those homes are under-occupied.
References
Cahill, K. M., Updegraff, K. A., Causadias, J. M., & Korous, K. M. (2021). Familism values and adjustment among Hispanic/Latino individuals: A systematic review and meta-analysis. Psychological Bulletin, 147(9), 947–985. https://doi.org/10.1037/bul0000336
Federal Reserve Bank of St. Louis. (n.d.). Regional price parities: New Mexico [Data set]. FRED. Retrieved July 22, 2026, from https://fred.stlouisfed.org/series/NMRPPALL
NAHB / Eye on Housing. (2025, November). Affordability impacts: Young adults are once again moving back home. https://eyeonhousing.org/2025/11/affordability-impacts-young-adults-are-once-again-moving-back-home/
Pew Charitable Trusts. (2025, January 21). Restrictive regulations fuel New Mexico’s housing shortage. https://www.pew.org/en/research-and-analysis/articles/2025/01/21/restrictive-regulations-fuel-new-mexicos-housing-shortage
Pew Charitable Trusts, & Gensler. (2025, August 5). Co-living buildings in Albuquerque and Santa Fe could improve housing affordability. Pew. https://www.pew.org/en/research-and-analysis/articles/2025/08/05/co-living-buildings-in-albuquerque-and-santa-fe-could-improve-housing-affordability
U.S. Census Bureau. (2023). Housing units: 2023: American Community Survey 1-year estimates (Table B25001) [Data set]. https://data.census.gov/table/ACSDT1Y2023.B25001
U.S. Census Bureau. (n.d.). QuickFacts: United States. Retrieved July 22, 2026, from https://www.census.gov/quickfacts/fact/table/US/HSG010225
U.S. Census Bureau. (2024). New Mexico [Data profile]. Census Reporter. Retrieved July 22, 2026, from https://censusreporter.org/profiles/04000US35-new-mexico/
Encyclopaedia Britannica. (n.d.). Largest U.S. state by population. Retrieved July 22, 2026, from https://www.britannica.com/topic/largest-U-S-state-by-population